
USD/JPY Price Forecast: Remains supported by 20-day EMA ahead of US NFP
- USD/JPY declines to near 157.60 as the US Dollar Index corrects to near 101.88.
- Investors shift their focus to the US NFP data for September.
- Tokyo inflation data ex. Fresh Food, Energy accelerates to 3% YoY in September.
The Japanese Yen (JPY) trades higher against the US Dollar (USD) ahead of the United States (US) Nonfarm Payrolls (NFP) data for September, which will be published at 12:30 GMT.
In the European trade, the USD/JPY pair is down 0.3% to near 157.60 due to weakness in the US Dollar. The US Dollar Index (DXY), which gauges the Greenback’s value against six major currencies, trades 0.15% lower to near 101.88. The DXY corrects from its yearly high of 102.20 posted on Thursday.
US Dollar Price Today
The table below shows the percentage change of US Dollar (USD) against listed major currencies today. US Dollar was the weakest against the Swiss Franc.
| USD | EUR | GBP | JPY | CAD | AUD | NZD | CHF | |
|---|---|---|---|---|---|---|---|---|
| USD | -0.05% | -0.08% | -0.30% | 0.09% | -0.16% | -0.20% | -0.31% | |
| EUR | 0.05% | -0.01% | -0.25% | 0.11% | -0.07% | -0.10% | -0.26% | |
| GBP | 0.08% | 0.00% | -0.23% | 0.13% | -0.06% | -0.09% | -0.23% | |
| JPY | 0.30% | 0.25% | 0.23% | 0.39% | 0.14% | 0.10% | -0.01% | |
| CAD | -0.09% | -0.11% | -0.13% | -0.39% | -0.25% | -0.31% | -0.41% | |
| AUD | 0.16% | 0.07% | 0.06% | -0.14% | 0.25% | -0.05% | -0.15% | |
| NZD | 0.20% | 0.10% | 0.09% | -0.10% | 0.31% | 0.05% | -0.10% | |
| CHF | 0.31% | 0.26% | 0.23% | 0.01% | 0.41% | 0.15% | 0.10% |
The heat map shows percentage changes of major currencies against each other. The base currency is picked from the left column, while the quote currency is picked from the top row. For example, if you pick the US Dollar from the left column and move along the horizontal line to the Japanese Yen, the percentage change displayed in the box will represent USD (base)/JPY (quote).
Analysts at OCBC wrote in a note that Bloomberg consensus expects "nonfarm payrolls to rise by 90,000 in September, down from 162,000 in August, while the unemployment rate is forecast to remain unchanged at 4.1%."
OCBC points out that "recent jobless claims data have continued to trend lower, suggesting labour market conditions remain firm." In their view, "the risk of an upside payrolls surprise appears to be increasing," and a "stronger-than-expected employment report would likely reinforce expectations of further Fed tightening, provide additional support for the USD."
On the Yen front, Tokyo’s Consumer Price Index (CPI) data for September remained stronger-than-projected. Tokyo CPI ex. Fresh Food jumps to 2.7% Year-on-Year (YoY) from 1.8% in August. The inflation data was seen at 2.4%. Tokyo CPI ex. Food, Energy accelerates at a significant pace to 3% YoY from the previous reading of 2%.
USD/JPY Technical Analysis
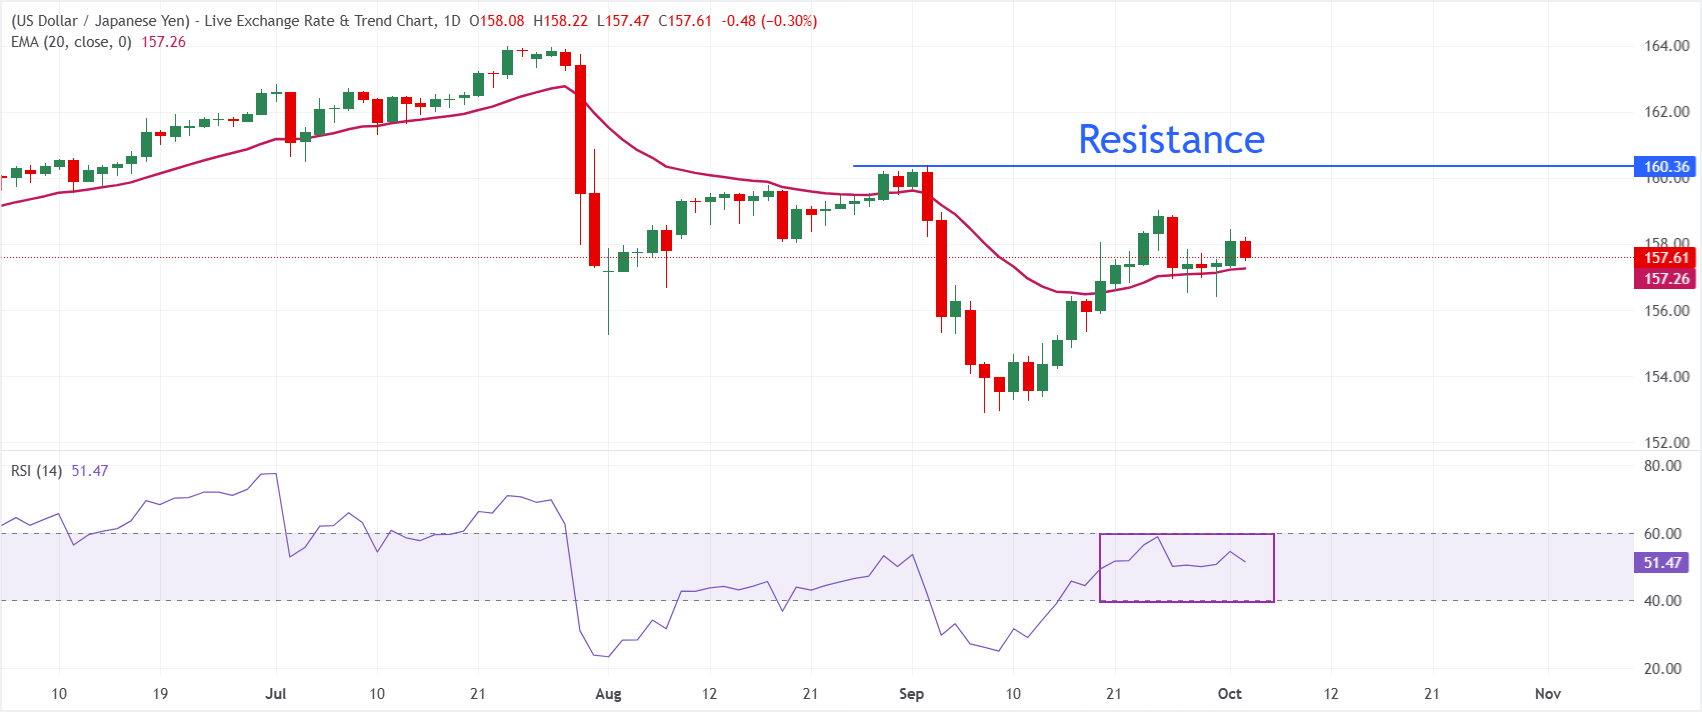
In the daily chart, USD/JPY trades at 157.61. The pair holds a mildly bullish near-term bias as spot trades above the 20-period exponential moving average (EMA) at 157.26, suggesting underlying demand on dips after the recent recovery from the mid-153s.
The Relative Strength Index (14) at 51.50 sits just above its neutral line, hinting at a steady, non-overextended upswing rather than aggressive trending conditions.
On the downside, immediate support is located at the 20-day EMA at 157.26, followed by the September 30 low at 156.38. On the upside, the September 24 high at 159.04 is the immediate resistance. Above 159.04, the September 2 high at 160.39 will be the key hurdle.
(The technical analysis of this story was written with the help of an AI tool. Know more.)
Economic Indicator
Nonfarm Payrolls
The Nonfarm Payrolls release presents the number of new jobs created in the US during the previous month in all non-agricultural businesses; it is released by the US Bureau of Labor Statistics (BLS). The monthly changes in payrolls can be extremely volatile. The number is also subject to strong reviews, which can also trigger volatility in the Forex board. Generally speaking, a high reading is seen as bullish for the US Dollar (USD), while a low reading is seen as bearish, although previous months' reviews and the Unemployment Rate are as relevant as the headline figure. The market's reaction, therefore, depends on how the market assesses all the data contained in the BLS report as a whole.
Read more.Next release: Fri Oct 02, 2026 12:30
Frequency: Monthly
Consensus: 90K
Previous: 162K
Source: US Bureau of Labor Statistics
America’s monthly jobs report is considered the most important economic indicator for forex traders. Released on the first Friday following the reported month, the change in the number of positions is closely correlated with the overall performance of the economy and is monitored by policymakers. Full employment is one of the Federal Reserve’s mandates and it considers developments in the labor market when setting its policies, thus impacting currencies. Despite several leading indicators shaping estimates, Nonfarm Payrolls tend to surprise markets and trigger substantial volatility. Actual figures beating the consensus tend to be USD bullish.